Gain insights into your app's performance
The Developer Dashboard includes metrics that provide insights into the performance of your published apps and your revenue.
App install metrics
You can view metrics for information, such as how many billable merchants have installed your apps in the past 12 months. Insights provided by these metrics give you visibility into merchant app usage trends. With this data, you can take action to increase app adoption and retain loyal merchants who support your business.
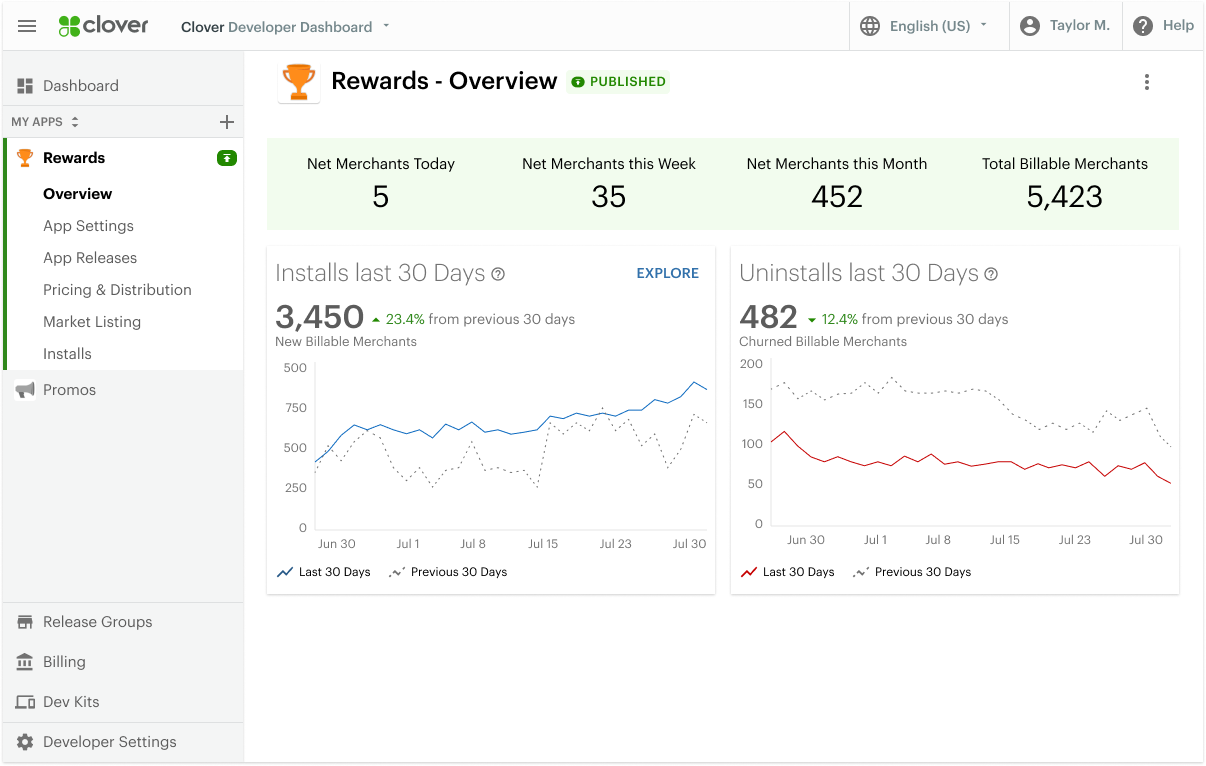
Screenshot showing the app install and uninstall trends
Click an app to see the metrics on the Overview page.
Here are ways in which you can use these metrics:
- Hover on the graph for details such as the number of Billable installs on a particular date and percentage change in installs over the previous months.
- Click Explore to see more details on the Installs page. These details include installations by subscription tier, device, and country.
- Use the filters to see Non-Billable installs, installs in a different period, or by your available subscription tiers.
- Search for a merchant to study trends like who your oldest merchant is or who your most loyal merchant is.
NOTEYou can view and interact with these metrics if:
- You are an owner or an admin of the developer account with permissions to manage apps and access charges for installs and revenue
- Your published app has 100 installs
Business questions
The App Install metrics can help you answer the following business questions:
- Which apps are most installed or uninstalled?
- Who is your most loyal merchant?
- What devices have merchants installed your apps on?
Revenue metrics
You can see the Revenue by App on the app Overview page. Click Explore to drill down to see the revenue generated by your apps in the past 12 months on the Billing > Statements page.
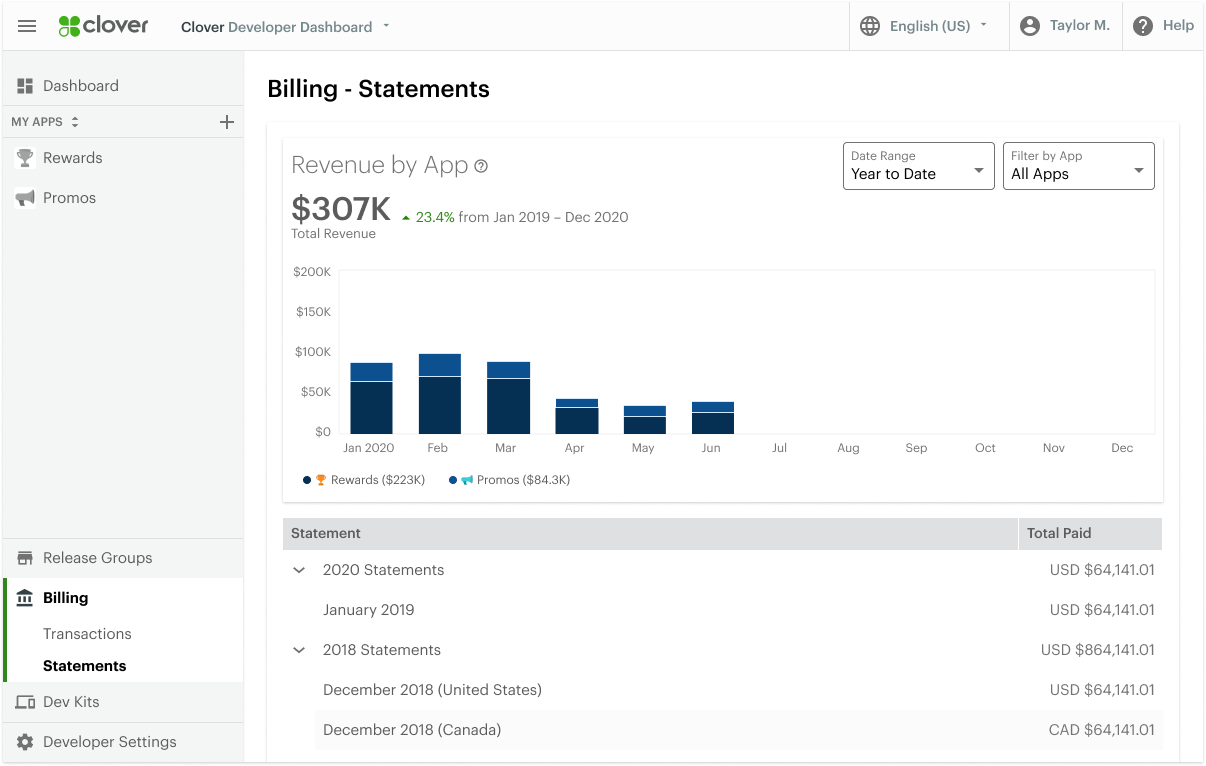
Screenshot of the revenue metrics on the Billing > Statements page.
If you have apps with paid subscription tiers on the App Market, you can view metrics for your account's performance and the amount billed to merchants in your statements. View revenue in each month for the last 12 months and identify apps that are bringing in more revenue than others. The amount shown on the graph is based on the total disbursed amount.
View the revenue metrics displayed on the Dashboard home.
Here's how you can use these metrics:
- Click Explore on the graph in the Dashboard home to see the revenue for all apps by country, or directly navigate to the Billing > Statements page.
- Change the Time Range by adjusting the filter value.
- Click a specific statement to see metrics for that month.
- Hover on the bar graph to see the breakdown of the amount for that month.
- Click the app name or use the Filter by App list legend to see the revenue generated by that app.
Business questions
The Revenue metrics by app can help you answer the following business questions:
- Which apps are making the most money?
- How are your apps performing in generating revenue?
Setup
The analytics pull data from the pricing tiers you set up when you created your app and the billing statements. See the documentation on Set up pricing tiers to review your billing setup.
Updated 13 days ago